Typically, when I introduce a new type of plot, I try to include a bit of an explanation of how it works. Afterwards, I tend to assume people have already gotten the idea and can be a little brief. That's maybe not the best way of doing things, so I'll go over the common types of plots I use and explain them in greater detail.
Box charts#
Wikipedia. Box plots are used to compare experimental data, typically echelon clear times/damage taken/damage contributions. A typical example:

With annotations:

Very broadly speaking, if the IQRs of two options does not overlap, it's reasonable to conclude one of them does better/worse than the other. Warrior likely leads to faster clear times than a Para, but Para isn't definitively faster than a Sniper.
Heatmaps#
Useful for analyzing multiple input variables at once, heatmaps appear to be one of the bigger challenges for people to understand:
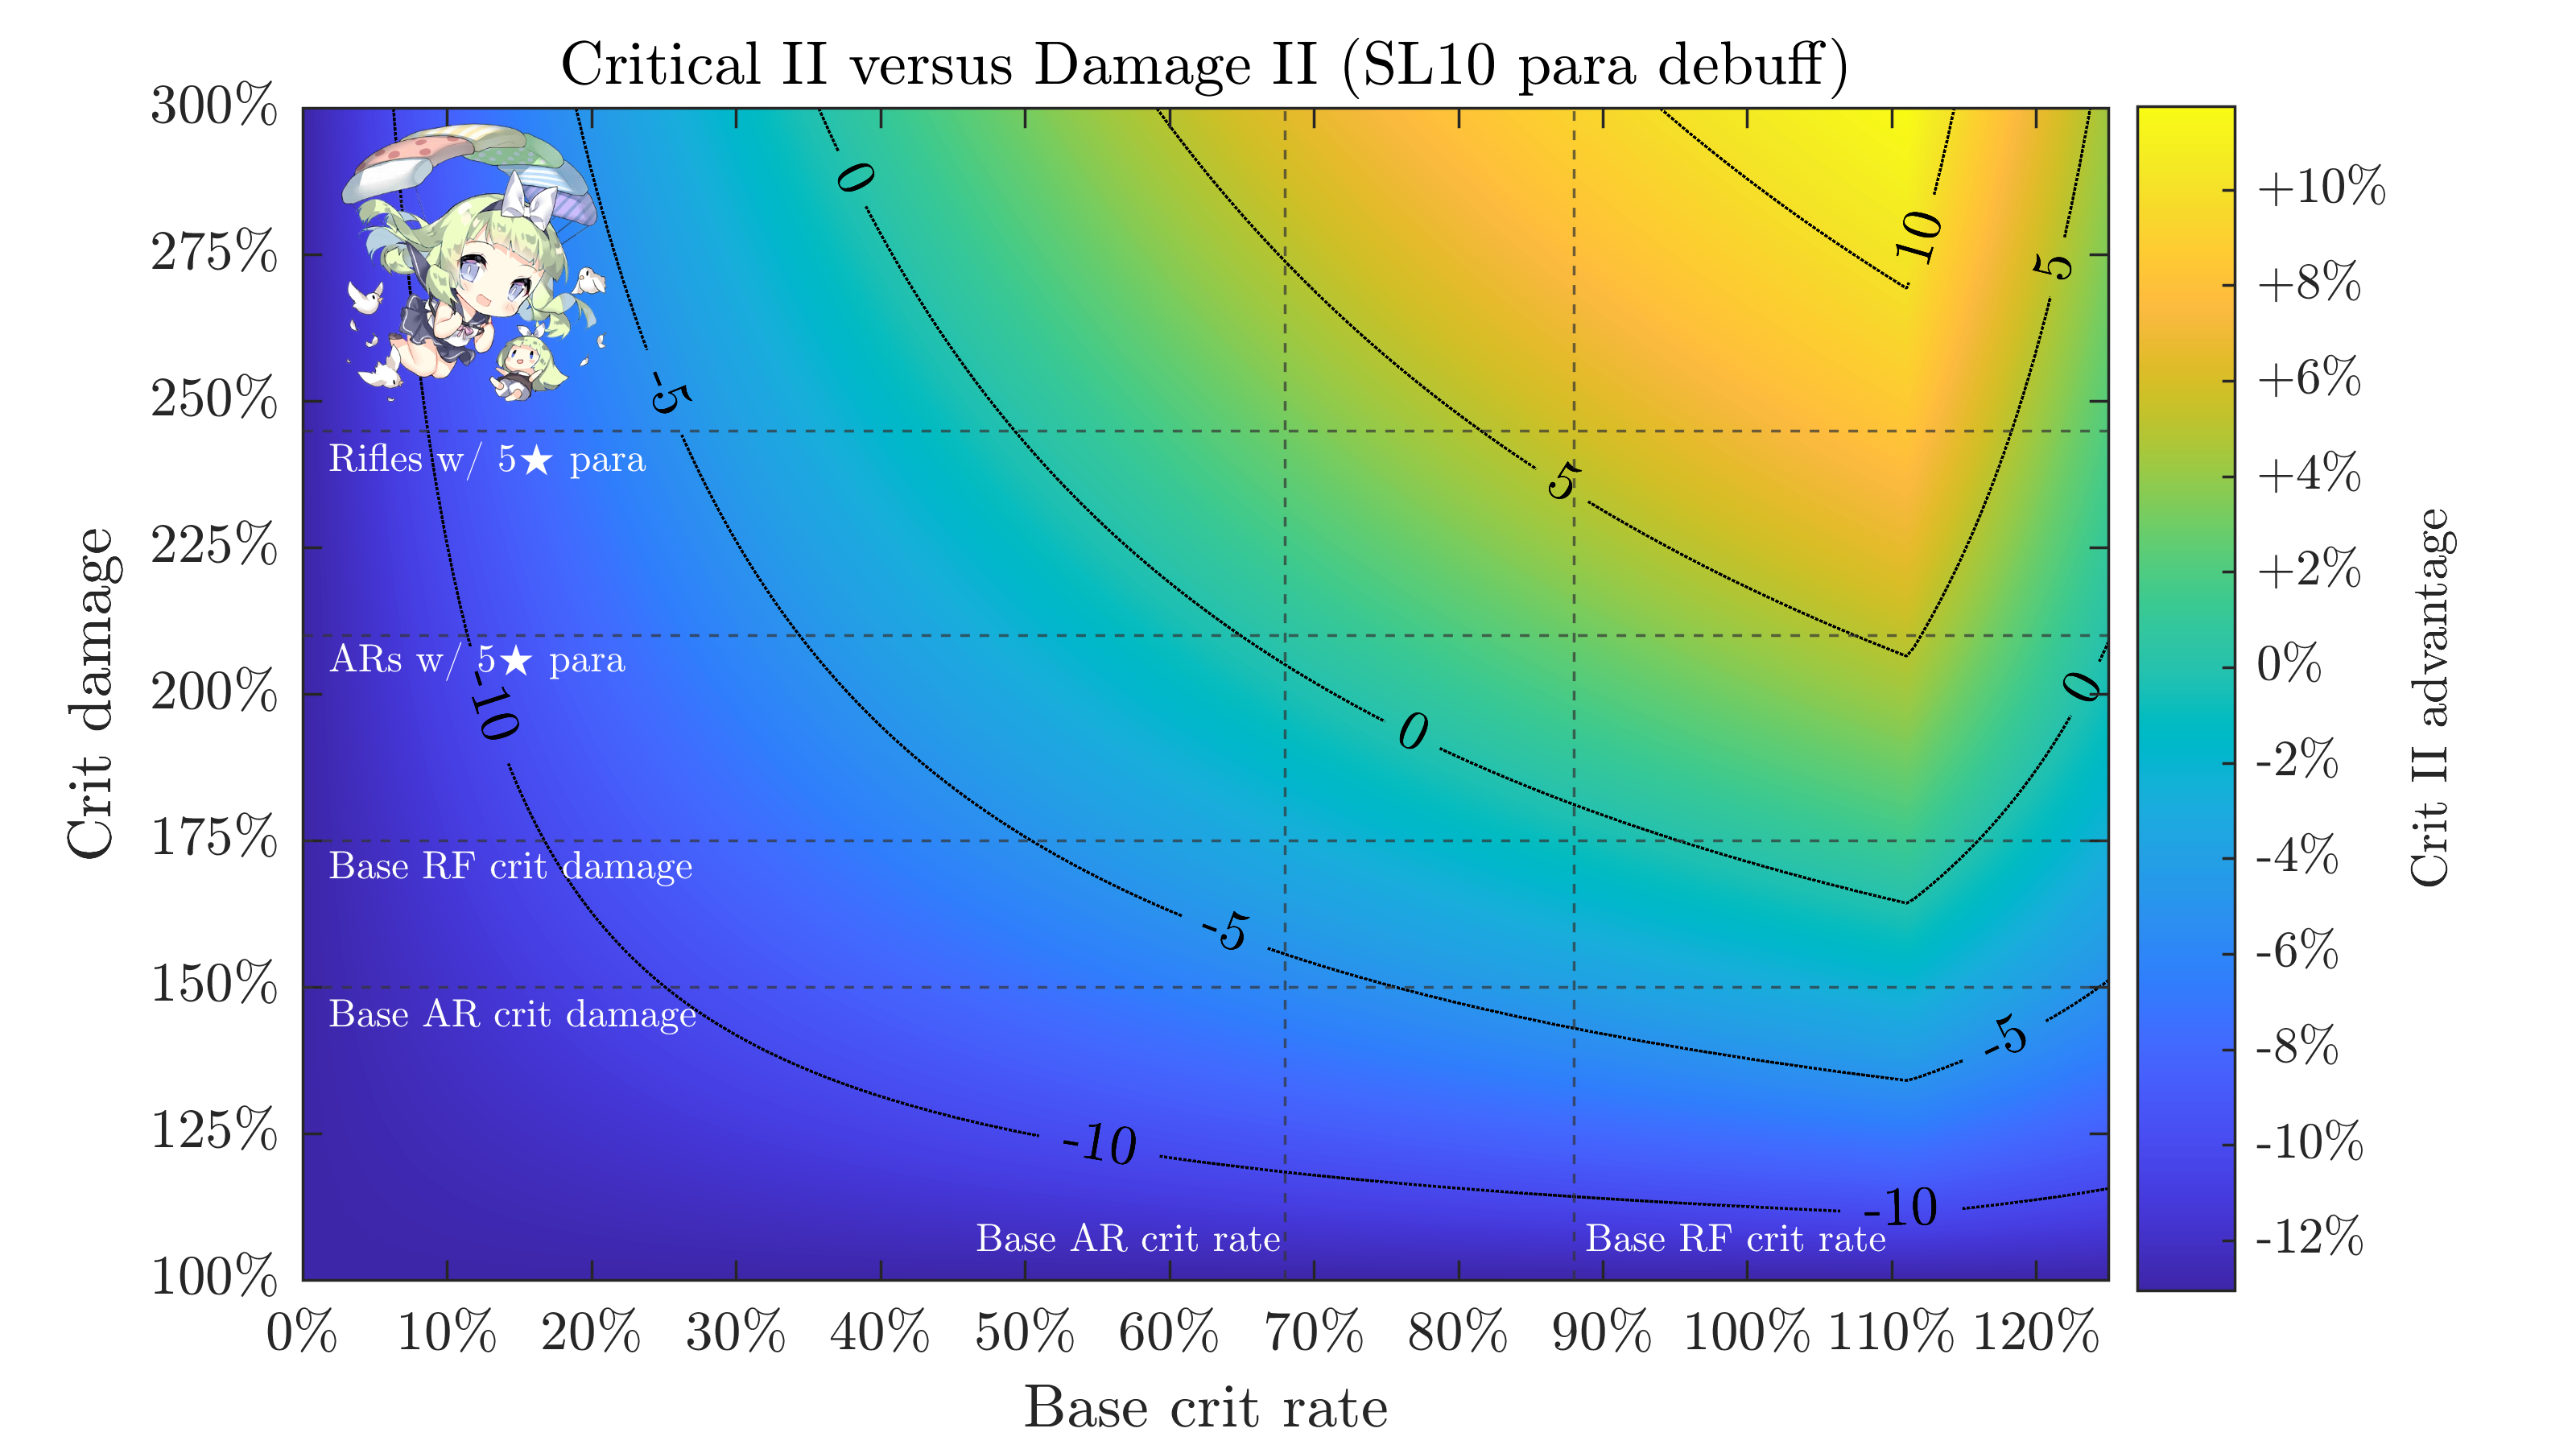
The x and y axes are our input variables. Other constants/conditions are explained in the title or surrounding text. For a given combination of, in this case, crit rate and crit damage, you find a color. That color maps onto the colorbar on the right, and gives you a value - here, the DPS advantage from Crit II over Damage II. Contour lines are also overlaid to help locate values/identify crossover regions.

Damage over time#

These charts plot the cumulative damage output of various dolls, relative to some reference unit (G41 is a popular pick).
Consider this (very narrow) excerpt of a damage sim's damage chart:
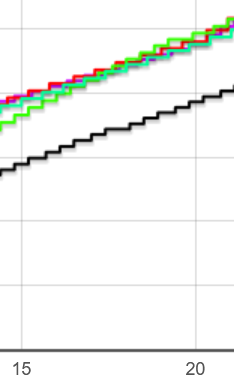
It shows the total damage each doll has done at each time. This can be hard to read and compare between units, so I take a smoothed-out version of that and divide each doll's total damage by the reference.
In the TKB chart, for example, we could say that once the battle has lasted for 11 seconds, 9A-91 will have dealt 60% more damage than G41 would have. AR-15 maintains a constant ~18% lead over G41 until 14 seconds, when G41's skill runs out and STAR's better uptime lets her rise to just above +30% total damage dealt.
Or, for an in-game analogue, take this damage chart (right):

If we were creating these charts based on combat tests, we could say that 15 seconds in, G41 is at (33%/33%)-100%=+0% as the reference, AK-15 at (36.1%/33%)-100%=+9.4%, and AN-94 at (31%/33%)-100%=-6%.
This isn't a perfect metric, still - early damage is generally at least somewhat more valuable than later damage, as you can save a lot of HP by killing things before they attack.
Scope optimization (I)#
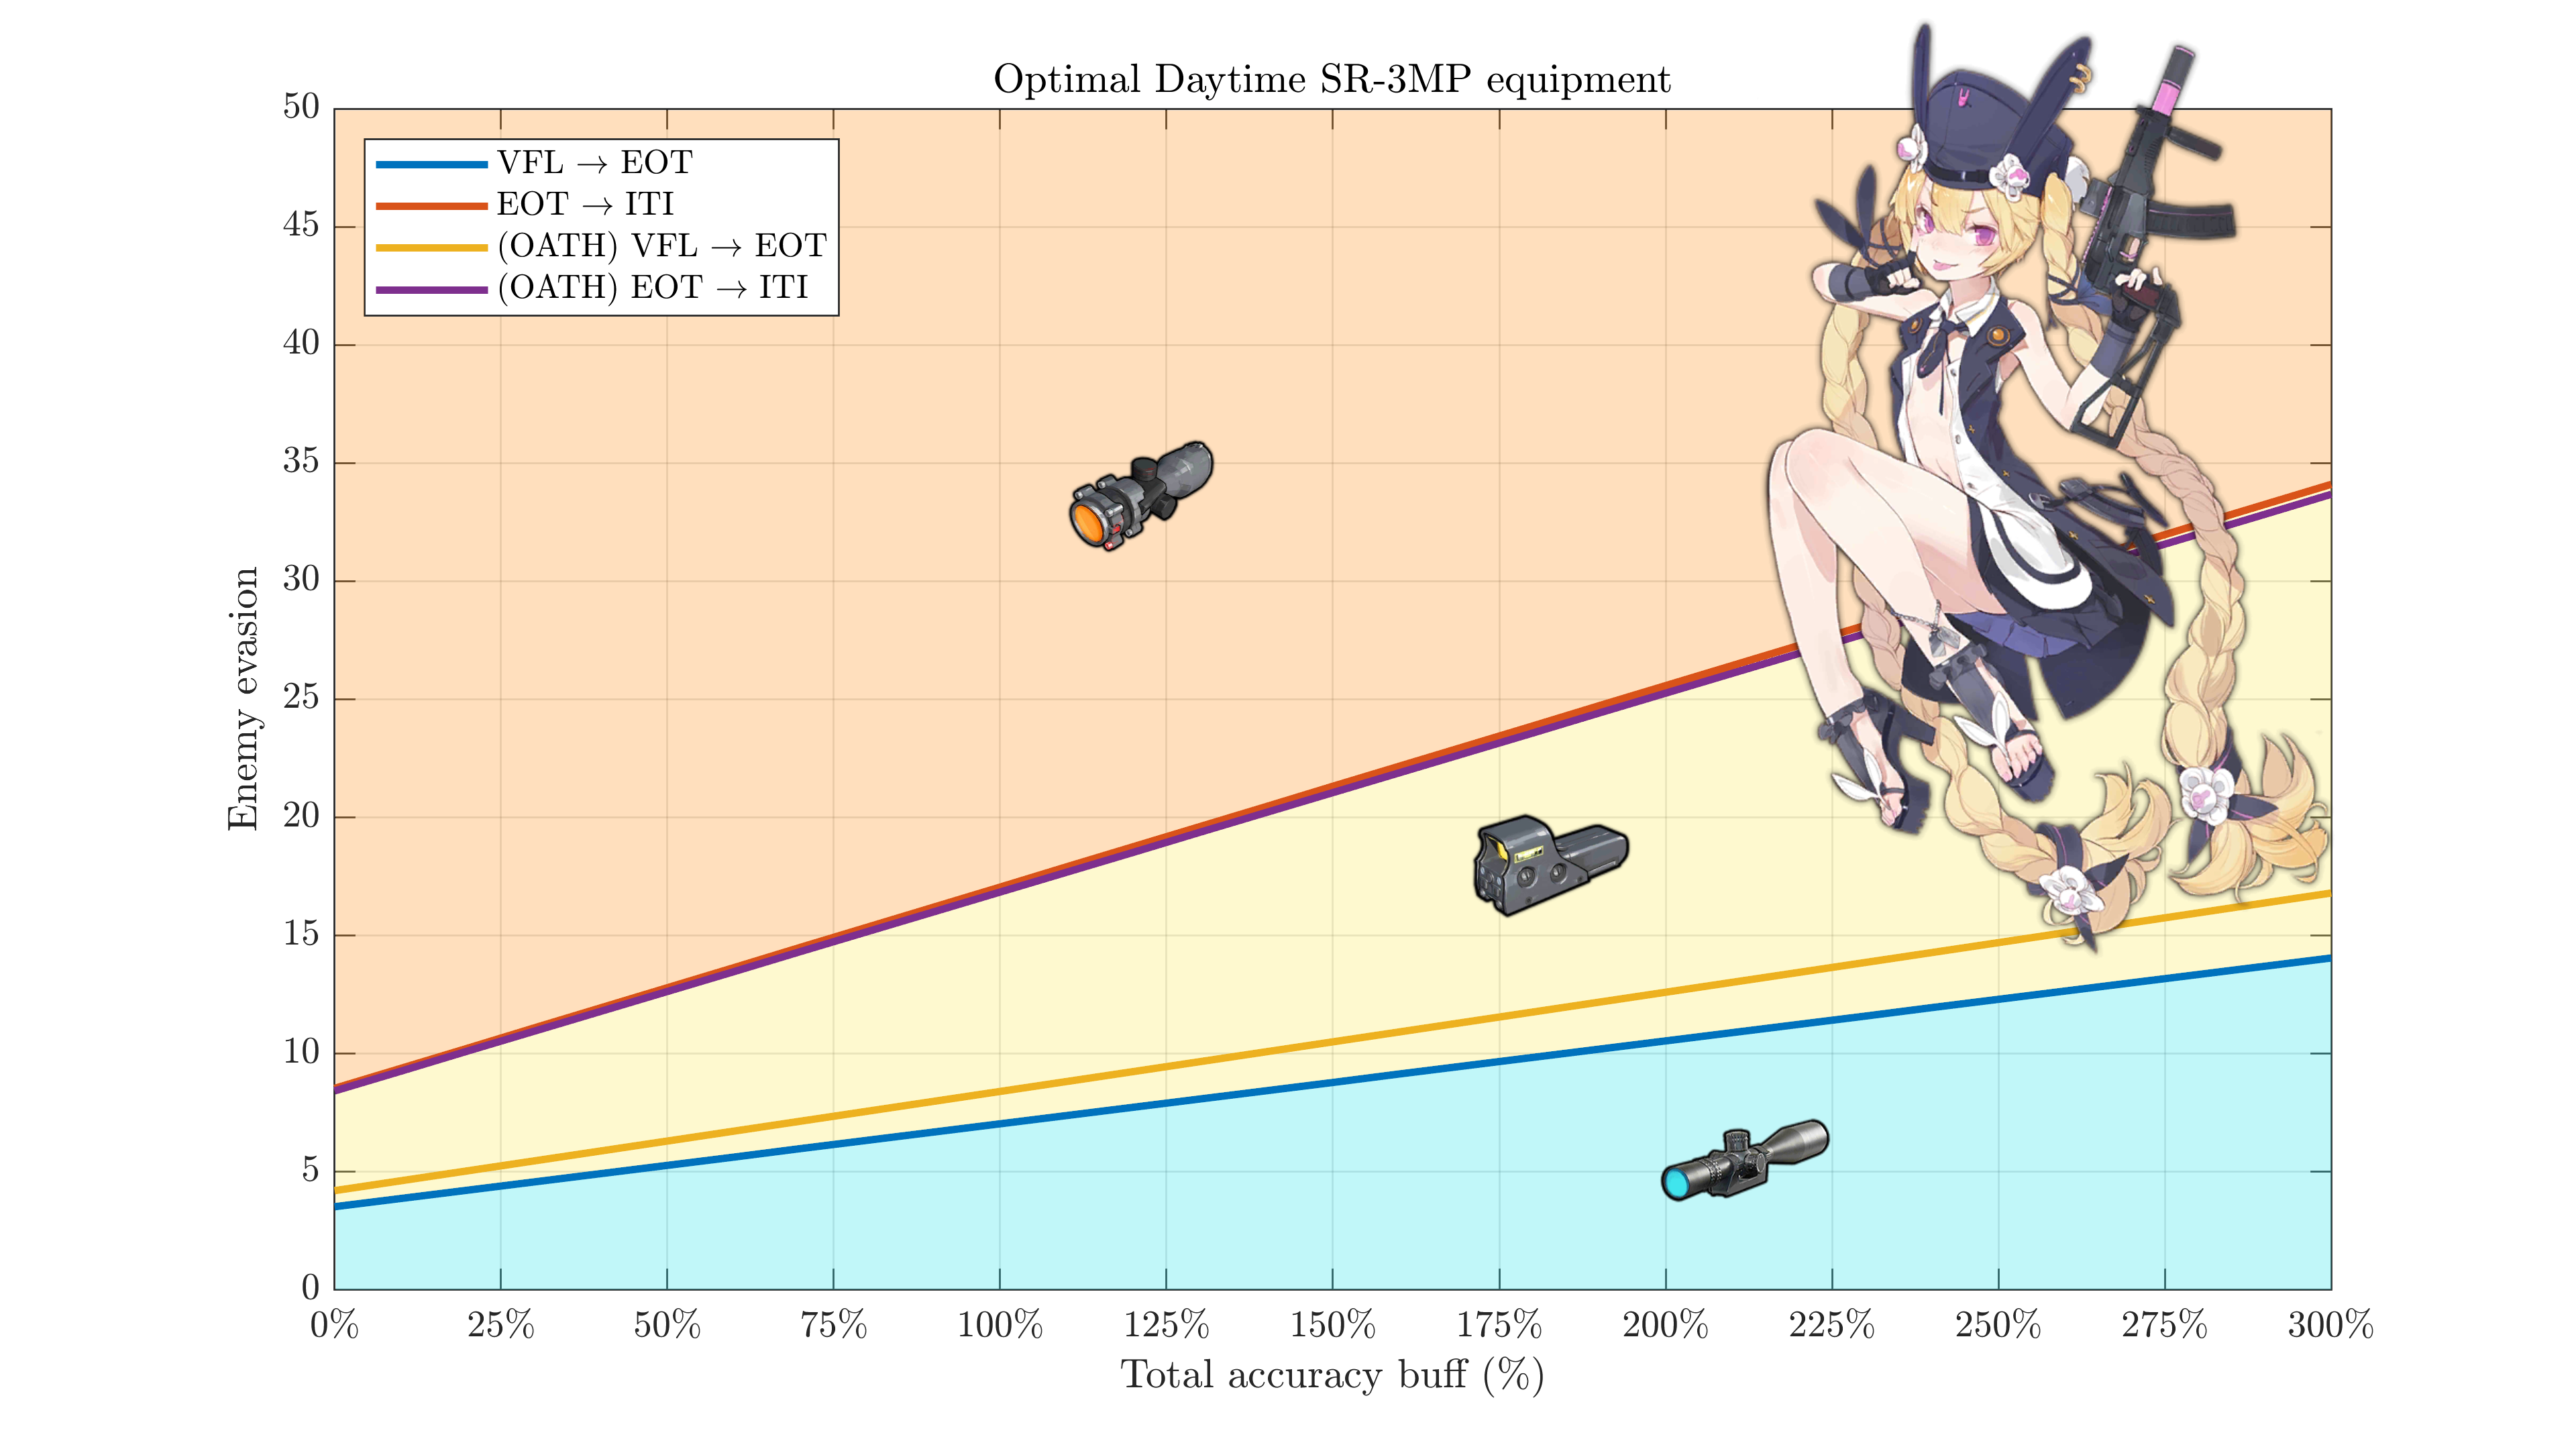
You could consider this as a simplified heatmap - rather than showing exact percentage values, this turns each region into a binary "best equipment." For a given set of conditions, total accuracy buff on Shrimp, and enemy evasion, pick whatever scope the intersection of those lies in.
Scope optimization (II)#
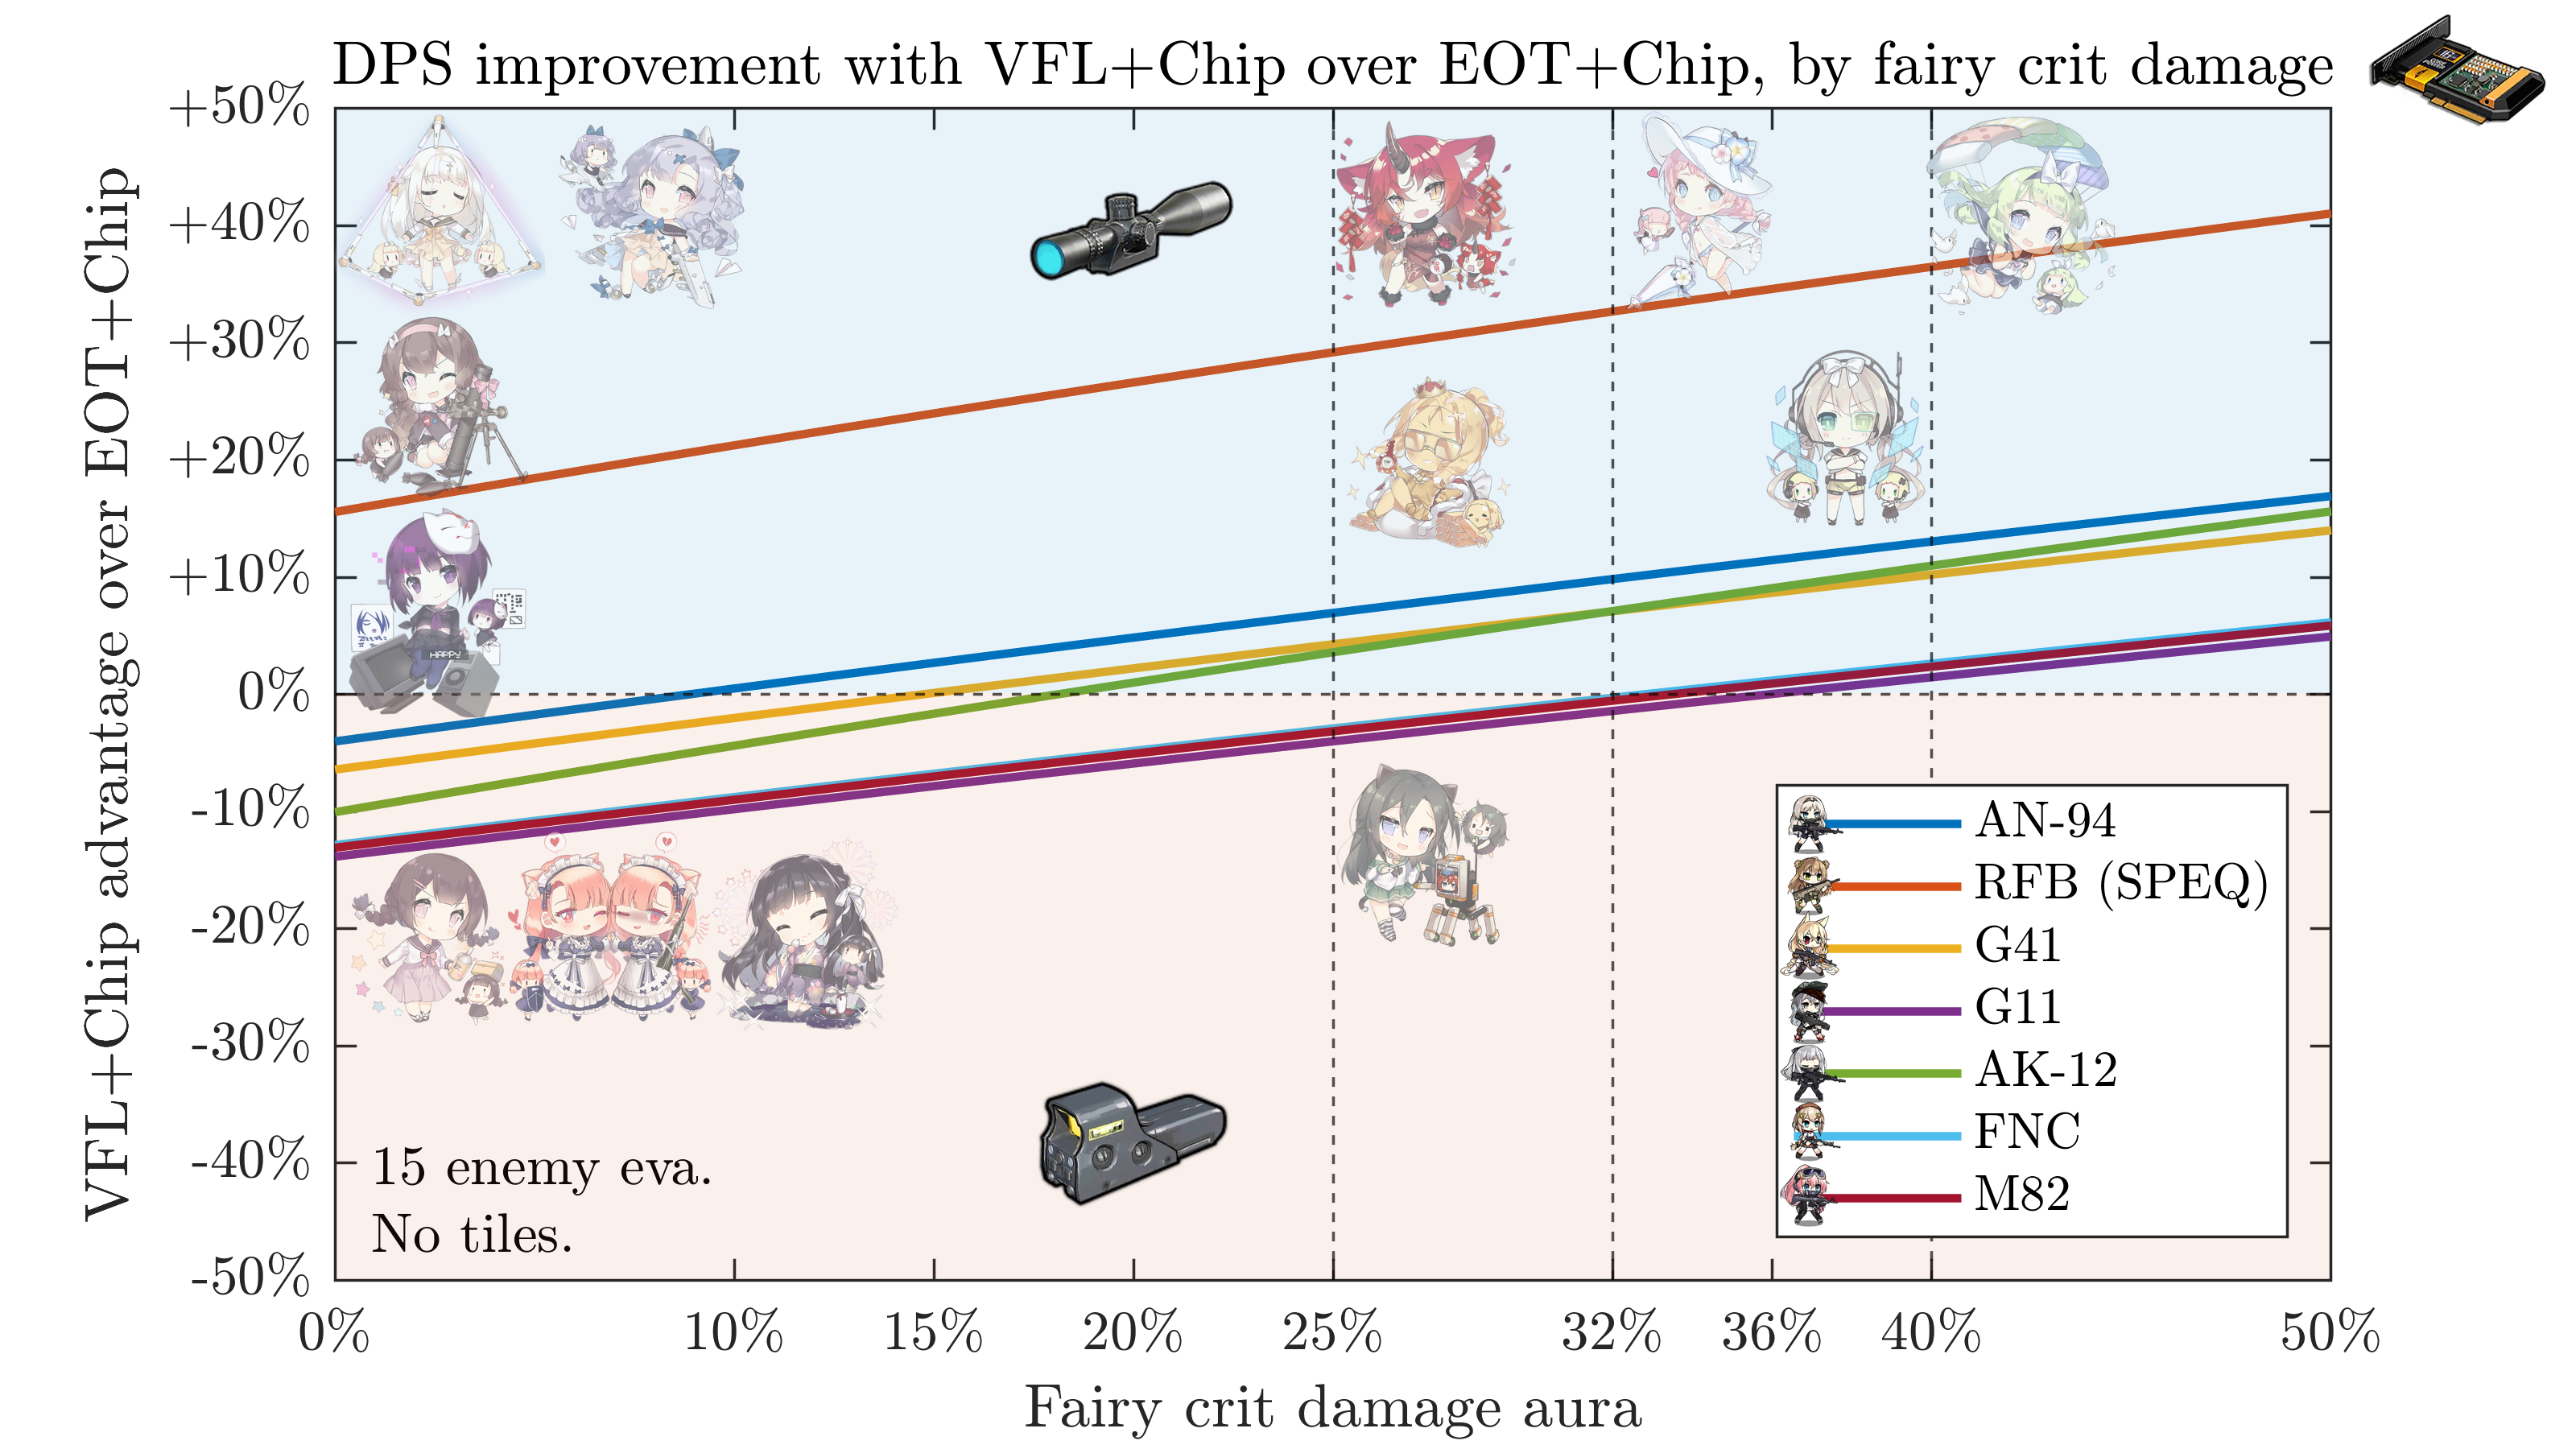
This one is pretty easy - for a given crit damage aura, compute the DPS of VFL+Chip and EOT+Chip (or whatever other options are being considered). Plot the % increase with VFL+Chip. If the increase is positive, pick VFL. If the increase is negative, VFLs give less DPS and you should use an EOT.